Kelvin's Data Table Pattern
This is a teaser of the project and does not show the entirety of the case study.
The problem
Kelvin's data tables were not optimized for troubleshooting many columns with large amounts of data at once. We needed to define interaction rules for the different types of data in a table so that a user could troubleshoot effectively.
Data tables display sensor and model data to track the performance of a pump or well for oil and gas clients such as BP. Production Optimizers and Domain Analysts look at this data to diagnose and help prevent equipment failures.
The result
As part of our Design System effort, I designed rules and guidelines to improve the usability of Kelvin's data tables. I brought the table up to industry standards by designing minimum width rules for truncating column data, tooltips, resizing and drag and drop functionality.

Before

After

Close up of after without drawer
Removing the clutter and writing rules
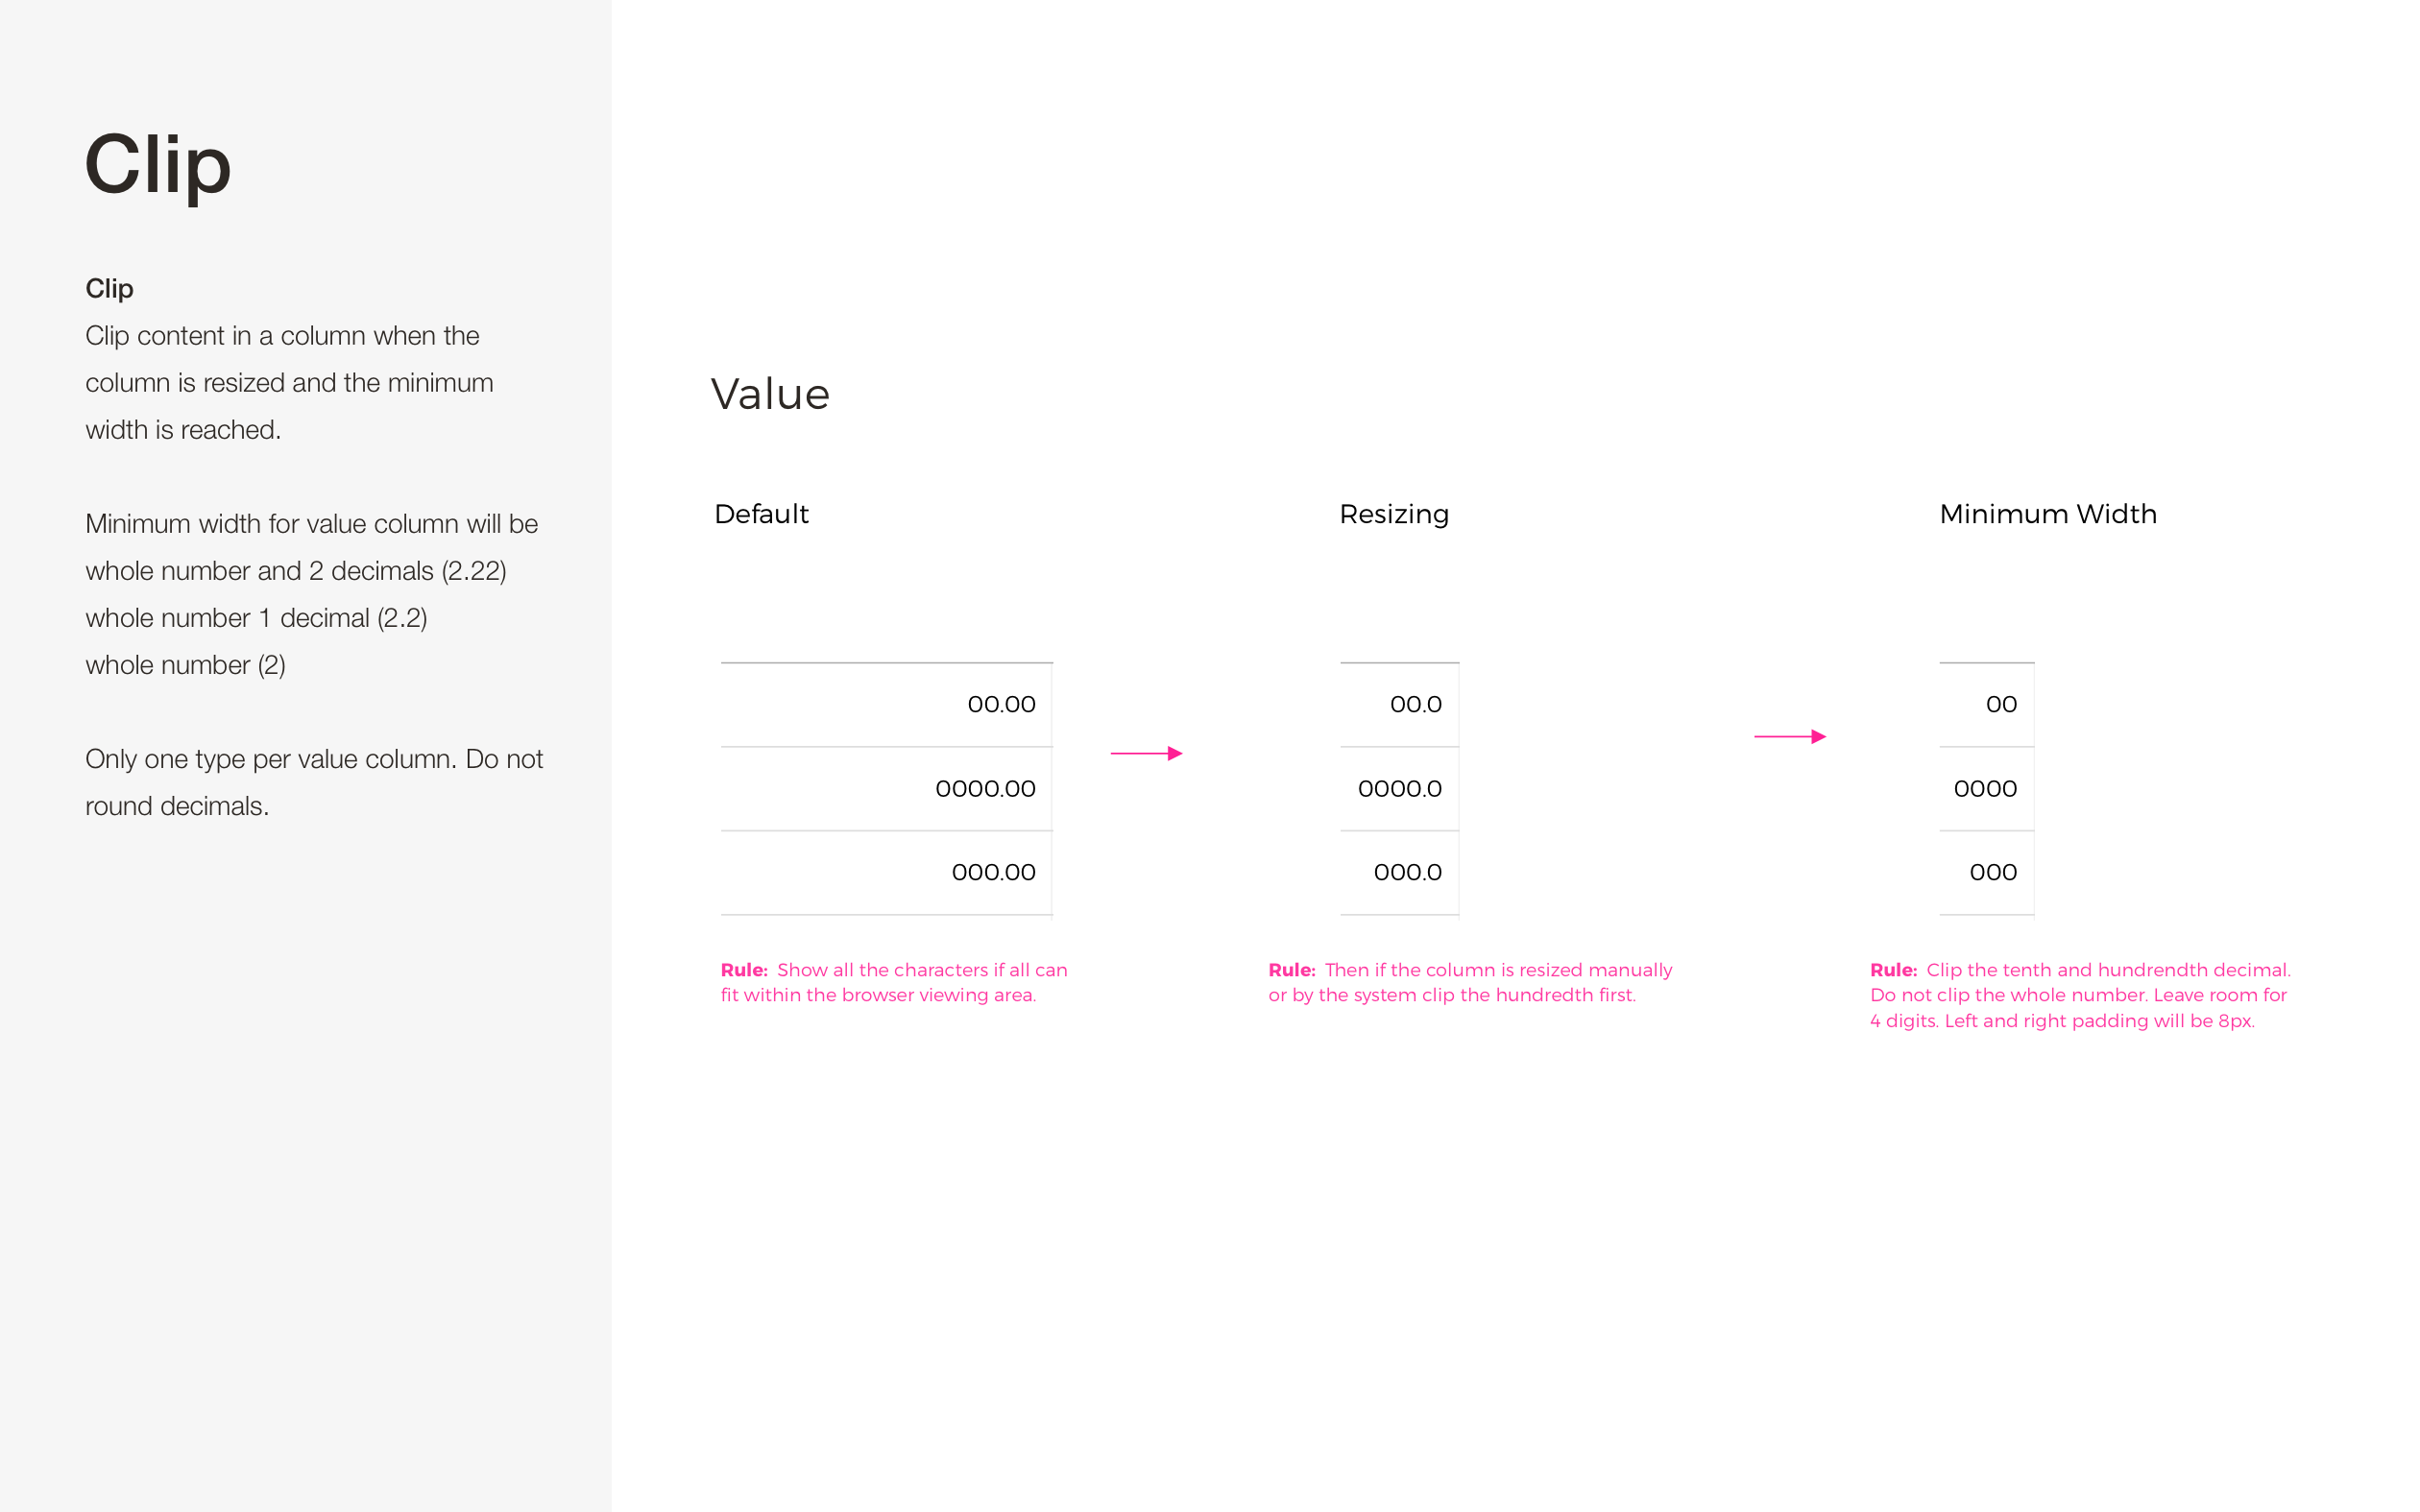
We defined ellipse, wrapping, clipping data truncation rules for the different types of data in a table so that a user could troubleshoot effectively.
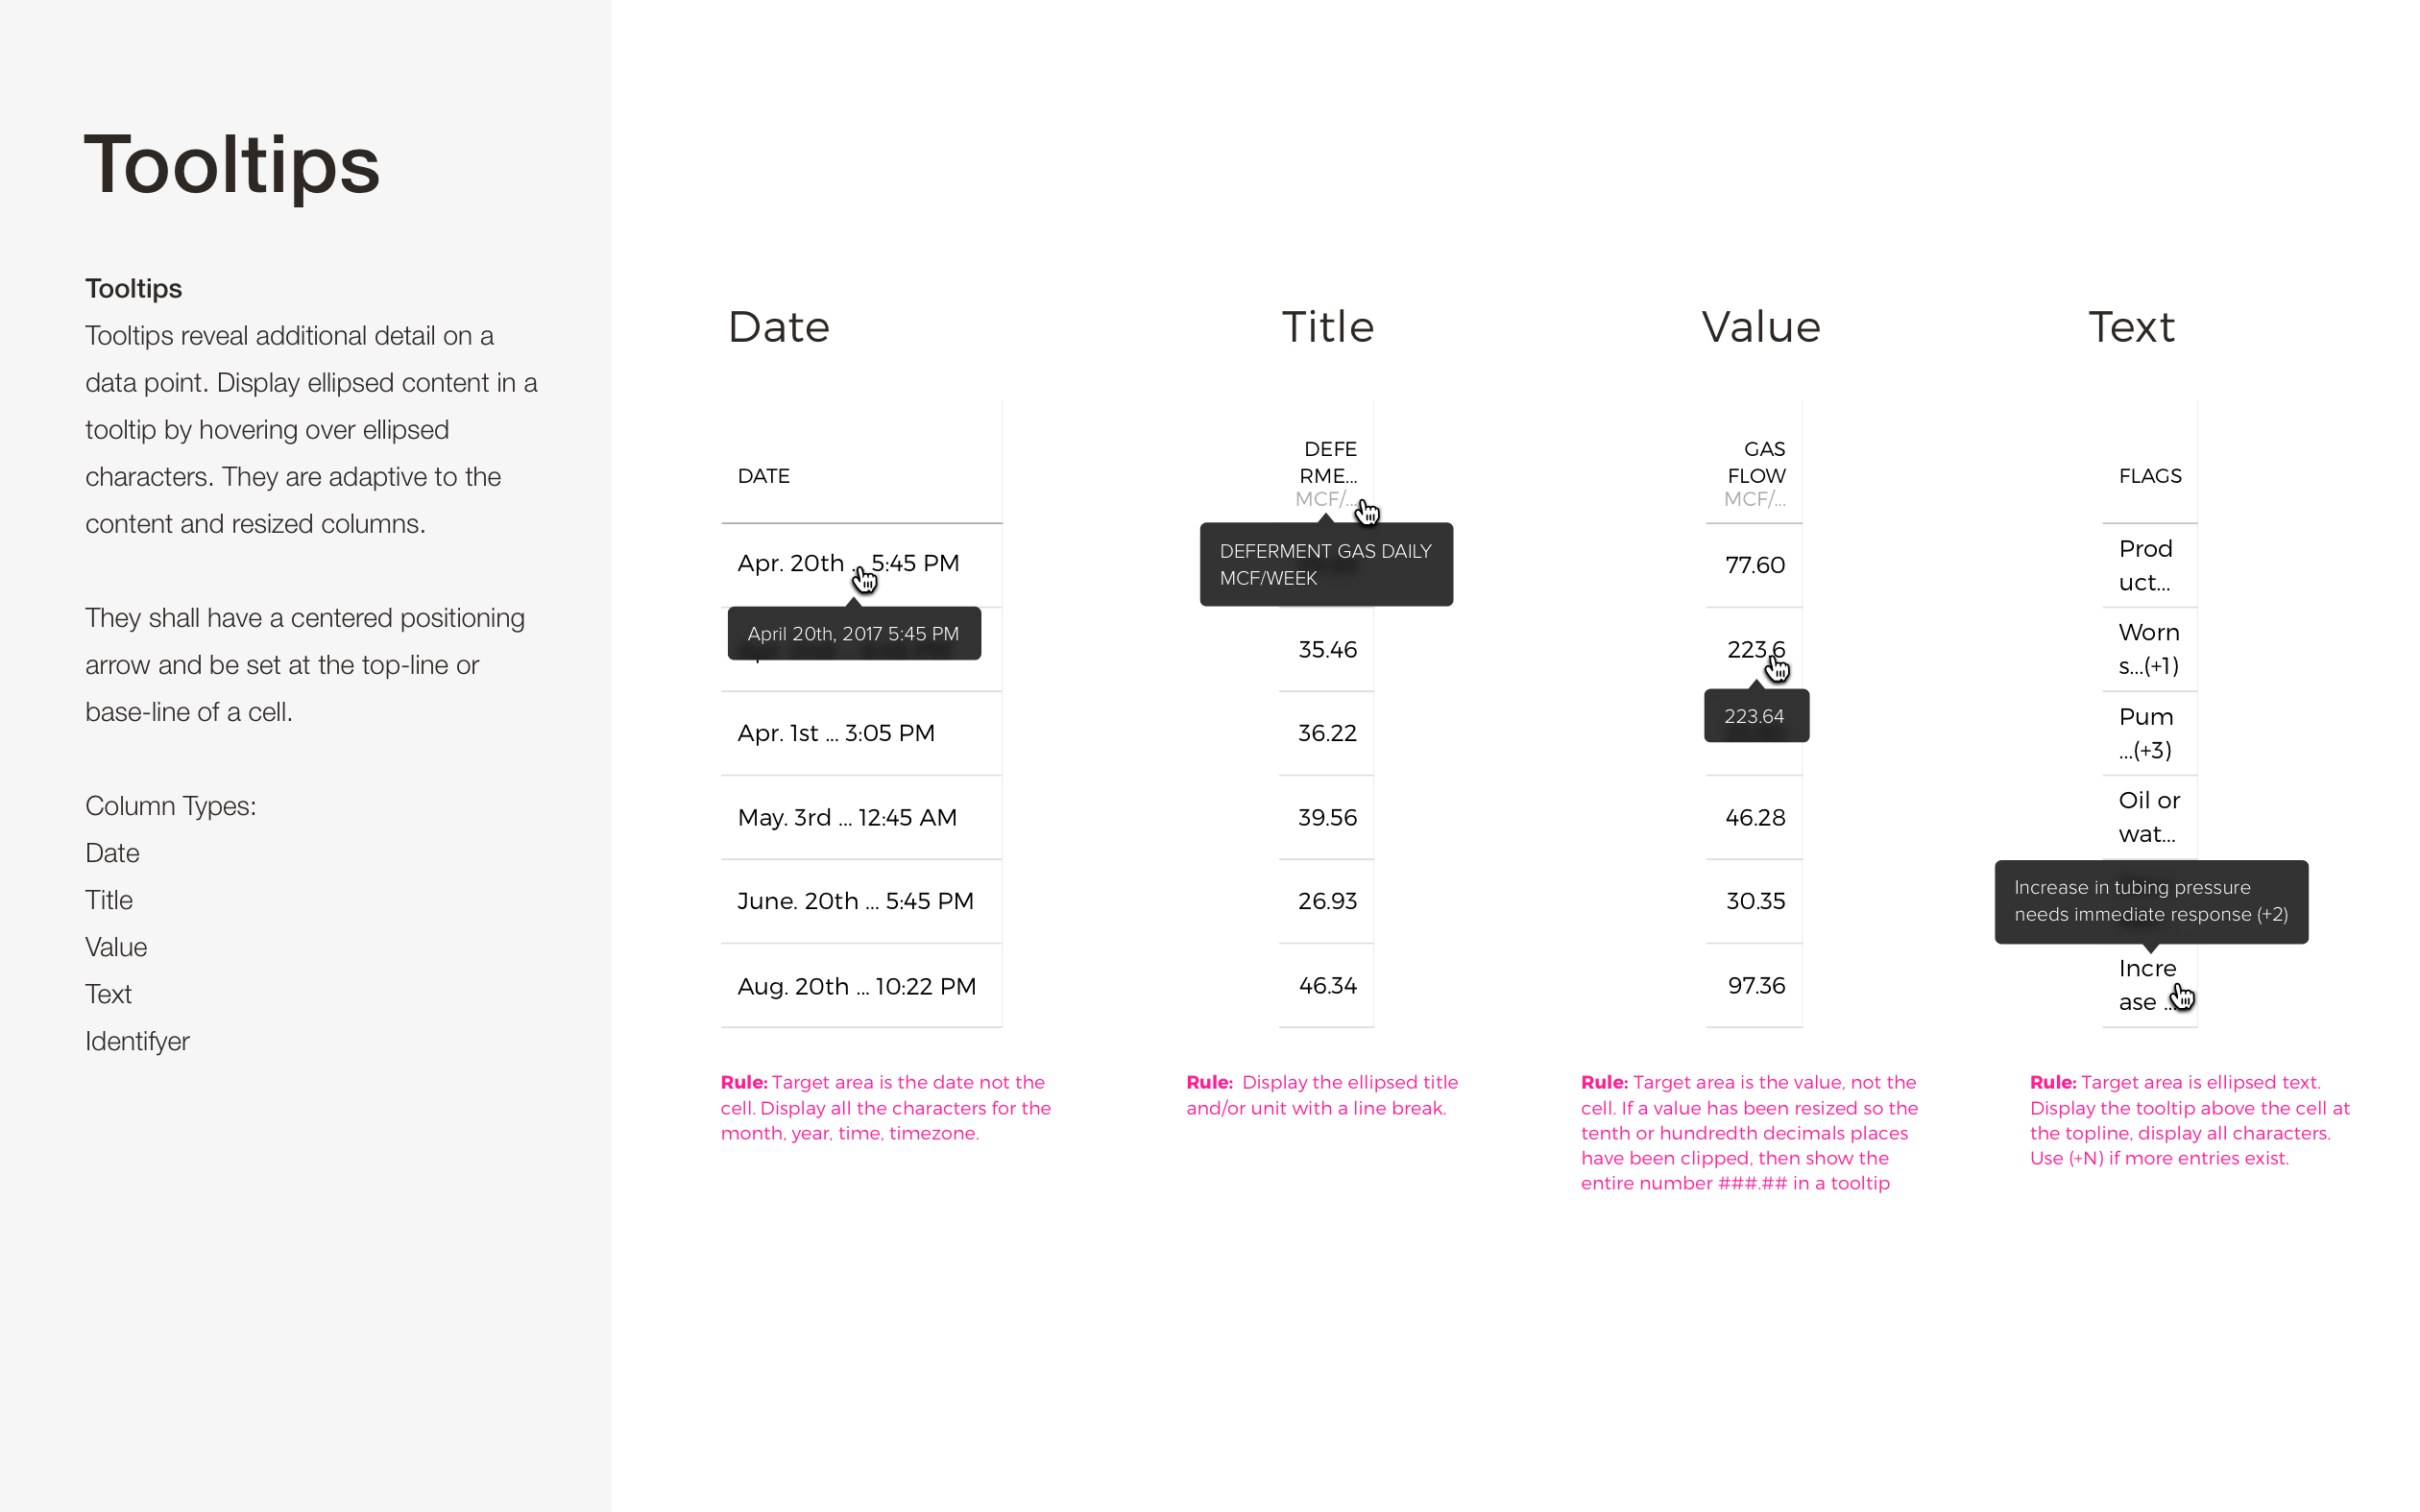
We talked to Domain Analysts and Production Optimizers about high vs low priority data for troubleshooting. We learned we could apply truncation rules to the “year” in a date column, the tenth and hundredths decimal places in all value columns, and the middle characters of a well name in an identifier column. We also cleaned up the styling and removed the zebra striping.
We designed tooltips and guidelines to allow a user to see the details of content that was ellipsed.
This is just a snapshot of the work, reach out to me on LinkedIn to start a conversation.